Example 2 - stripy predefined meshes
Contents
Example 2 - stripy predefined meshes
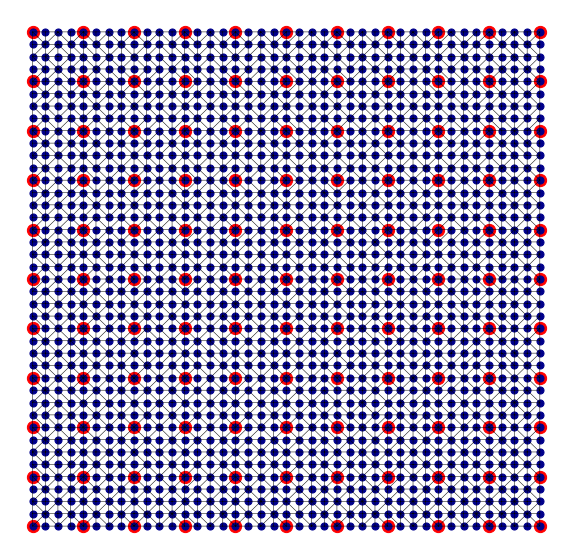
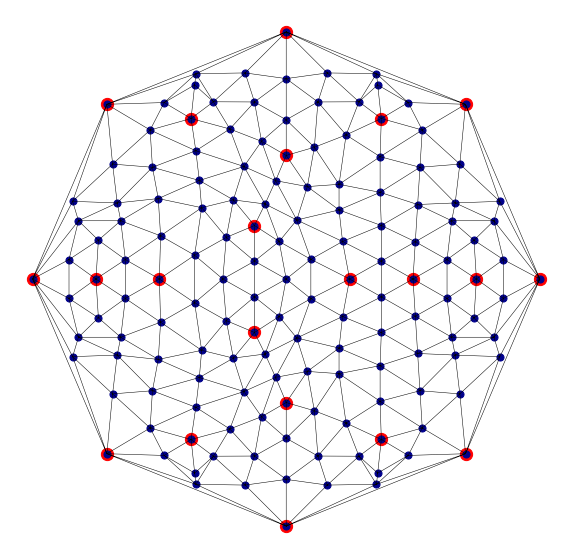
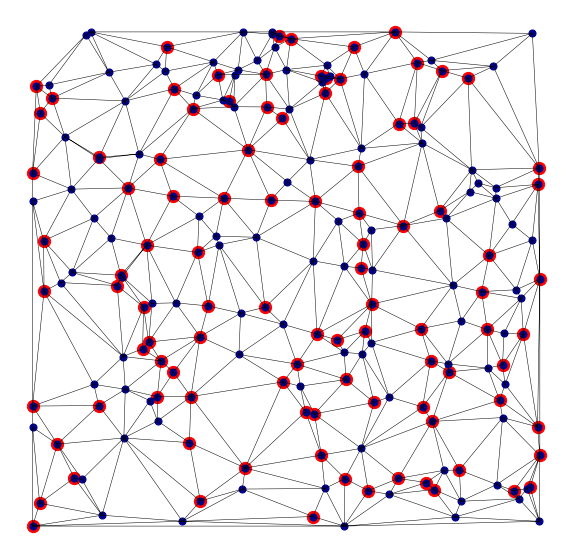
One common use of stripy is in meshing x,y coordinates and, to this end, we provide pre-defined meshes for square and elliptical triangulations. A random mesh is included as a counterpoint to the regular meshes. Each of these meshes is also a Triangulation object.
The Cartesian mesh classes in stripy are:
stripy.cartesian_meshes.square_mesh(extent, spacingX, spacingY)
stripy.cartesian_meshes.elliptical_mesh(extent, spacingX, spacingY)
stripy.cartesian_meshes.random_mesh(extent, number_of_points=5000)
Any of the above meshes can be uniformly refined by specifying the refinement_levels parameter. The square and elliptical meshes come with a random_scale parameter that specifies the amount of random noise to be added to the mesh (random_scale=0 by default).
Notebook contents
The next example is Ex3-Interpolation
Sample meshes
We create a number of meshes from the basic types available in stripy with approximately similar numbers of vertices.
import stripy

## A bunch of meshes with roughly similar overall numbers of points / triangles
xmin = 0.0
xmax = 10.0
ymin = 0.0
ymax = 10.0
extent = [xmin, xmax, ymin, ymax]

spacingX = 1.0
spacingY = 1.0

nsamples = 5000

str_fmt = "{:25} {:3}\t{:6}"


square0  = stripy.cartesian_meshes.square_mesh(extent, spacingX, spacingY, refinement_levels=0)
square2  = stripy.cartesian_meshes.square_mesh(extent, spacingX, spacingY, refinement_levels=2)
squareR  = stripy.cartesian_meshes.square_mesh(extent, spacingX, spacingY, refinement_levels=4)

print(str_fmt.format('Square mesh', square0.npoints, squareR.npoints))

ellip0  = stripy.cartesian_meshes.elliptical_mesh(extent, spacingX, spacingY, refinement_levels=0)
ellip2  = stripy.cartesian_meshes.elliptical_mesh(extent, spacingX, spacingY, refinement_levels=2)
ellipR  = stripy.cartesian_meshes.elliptical_mesh(extent, spacingX, spacingY, refinement_levels=4)

print(str_fmt.format('Elliptical mesh', ellip0.npoints, ellipR.npoints))

randR = stripy.cartesian_meshes.random_mesh(extent, nsamples)
rand0 = stripy.Triangulation(randR.x[::50], randR.y[::50])
rand2 = stripy.Triangulation(randR.x[::25], randR.y[::25])


print(str_fmt.format('Random mesh', rand0.npoints, randR.npoints))
Square mesh               121	 25921
Elliptical mesh            21	  1301
(276,) (276,)
Random mesh               100	  5000
print("Square: {}".format(square0.__doc__))

print("Elliptical: {}".format(ellip0.__doc__))

print("Random: {}".format(randR.__doc__))
Square:
    A square mesh where points are uniformly populated
    along x and y directions defined by extent.

Elliptical:
    An elliptical mesh where points are successively populated at an
    increasing radius from the midpoint of the extent.

    Caution in parallel and for reproducibility - random noise in point locations !

Random:
    A mesh of random points. Take care if you use this is parallel
    as the location of points will not be the same on all processors.
Analysis of the characteristics of the triangulations
We plot a histogram of the (spherical) areas of the triangles in each of the triangulations normalised by the average area. This is one measure of the uniformity of each mesh.
%matplotlib inline
import matplotlib.pyplot as plt
import numpy as np

def area_histo(mesh):

    freq, area_bin = np.histogram(mesh.areas(), bins=20, normed=True)
    area = 0.5 * (area_bin[1:] + area_bin[:-1])
    norm_area = area / mesh.areas().mean()

    return norm_area, 0.25 * freq*area / np.pi**2

def add_plot(axis, mesh, xlim, ylim):
    u, v = area_histo(mesh)
    width = (u.max() - u.min()) / 30.
    axis.bar(u, v, width=width)
    axis.set_ylim(ylim)
    axis.plot([1.0,1.0], [0.0,1.5], linewidth=1.0, linestyle="-.", color="Black")

    return


fig, ax = plt.subplots(1,3, figsize=(14,4))

xlim=(0.75,1.5)
ylim=(0.0,0.05)

# square

add_plot(ax[0], squareR, xlim, ylim)

# elliptical

add_plot(ax[1], ellipR, xlim, ylim)

# random (this one is very different from the others ... )

add_plot(ax[2], randR, xlim, ylim)


fig.savefig("AreaDistributionsByMesh.png", dpi=250, transparent=True)
/Users/runner/miniconda3/envs/conda-build-docs/lib/python3.7/site-packages/ipykernel_launcher.py:7: VisibleDeprecationWarning: Passing `normed=True` on non-uniform bins has always been broken, and computes neither the probability density function nor the probability mass function. The result is only correct if the bins are uniform, when density=True will produce the same result anyway. The argument will be removed in a future version of numpy.
  import sys

Plot and compare the predefined meshes
def mesh_fig(mesh, meshR, name):

    fig = plt.figure(figsize=(10, 10), facecolor="none")
    ax  = plt.subplot(111)
    ax.axis('off')

    generator = mesh
    refined   = meshR

    x0 = generator.x
    y0 = generator.y

    xR = refined.x
    yR = refined.y


    ax.scatter(x0, y0, color="Red", marker="o", s=150.0)
    ax.scatter(xR, yR, color="DarkBlue", marker="o", s=50.0)

    ax.triplot(xR, yR, refined.simplices, color="black", linewidth=0.5)

    fig.savefig(name, dpi=250, transparent=True)

    return

mesh_fig(square0,  square2, "Square" )

mesh_fig(ellip0, ellip2, "Elliptical" )

mesh_fig(rand0, rand2, "Random" )


The next example is Ex3-Interpolation